
In short
Learn how to move beyond basic video play counts to analyse live attendance, drop-off curves, and segmented reach across Microsoft Stream and Viva Engage, and how to unify these insights into a cross-channel communication strategy.
Key takeaways
- Analyse live attendance and engagement in real-time during your Viva Engage town halls.
- Track video drop-off curves on Microsoft Stream to see exactly when viewers lose interest.
- Segment your town hall reach by department and region to find hidden gaps in your communications.
- Avoid Microsoft Graph reporting API errors by bypassing unstable custom Power BI setups.
Track live attendance and real-time interaction in Viva Engage town halls
When you organise high-profile live events, relying on basic play counts or simple, fragmented metrics does not give you the full story. Microsoft 365 native analytics provide a basic event-level view, but they lack the cross-channel context required to truly evaluate internal comms performance. To prove your impact to leadership, you need to understand how employees interact with your town halls in real time and on demand. Analysing live attendance, active chat participation, and regional distribution helps you move beyond vanity numbers. This depth of insight is essential if you want to optimise your corporate broadcasts and ensure that critical messages from executive leadership are actually reaching the right audiences.
Understand who tunes in to your live broadcasts
A common frustration with native analytics limitations is the inability to filter viewers by department, region, or job function. This is where dedicated platforms like Analytics for Viva Engage make a difference. By connecting directly with your Active Directory or an HR file import, you can instantly map live and on-demand engagement to your target audience segments. This level of granularity helps you identify if employees in engineering are tuning in as actively as those in sales, or if specific offices are missing your broadcasts altogether. Because Tryane is SOC 2 Type 2 certified and GDPR compliant by design, your data is completely secure. We deploy in a couple of hours using Azure AD or Entra ID for a seamless SSO setup, hosting your data in the EU by default with US data residency options available on demand.
Analyse drop-off curves to optimise engagement
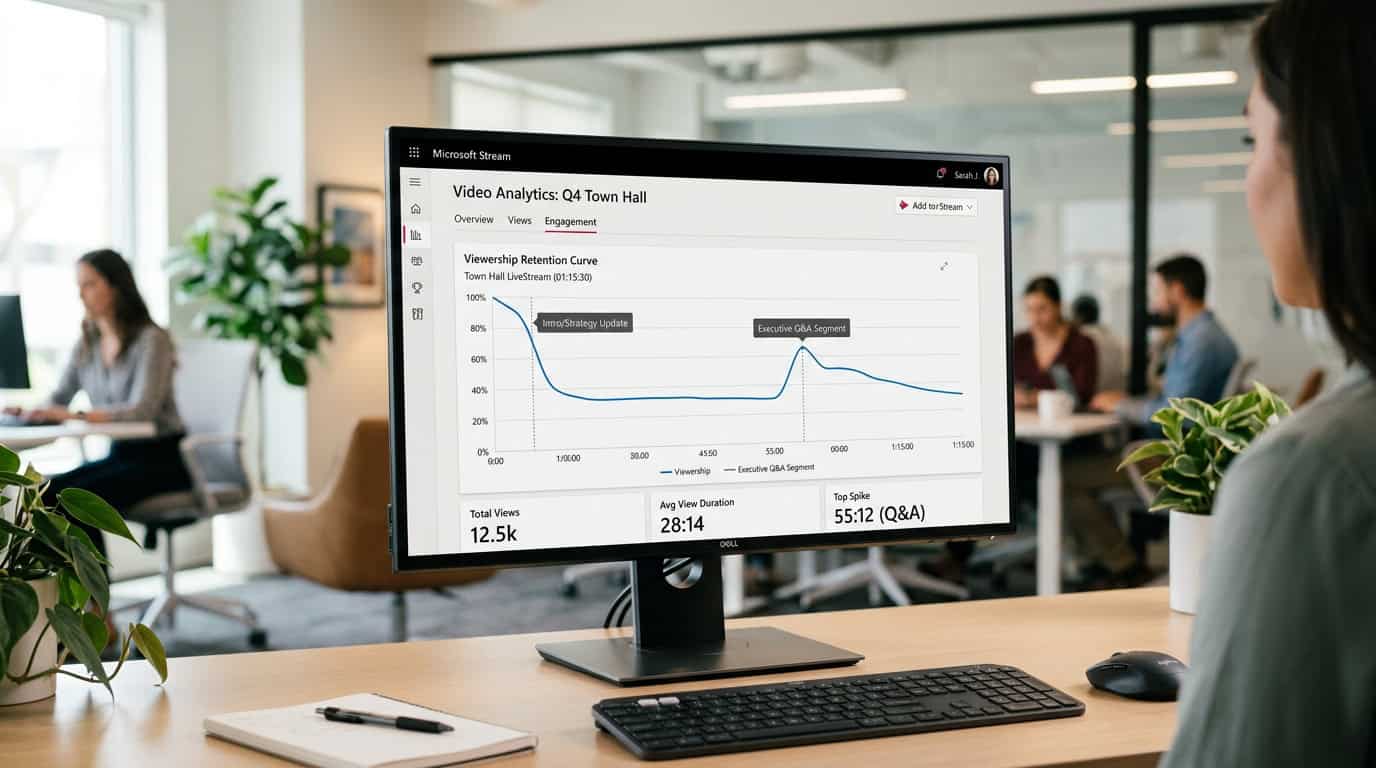
To measure employee engagement during a town hall, you must look at live drop-off curves. Knowing that an employee clicked play on your town hall is meaningless if they logged off after five minutes. When you examine the exact minute-by-minute audience retention, you can see where people lost interest or where the Q&A section sparked a re-engagement. By integrating these video metrics into a broader, cross-channel perspective via Communication Insights, you see the complete picture. Our all-in-one cross-channel platform merges data from SharePoint, Viva Engage, Teams, and newsletters into a single centralised view, allowing you to stop wasting time juggling multiple reports.
If you are comparing Tryane vs Swoop Analytics or evaluating tygraph alternatives, our platform is built specifically to save you time by offering executive-ready templates right out of the box. While custom Power BI setups are common, they come with substantial technical hurdles. Although Power BI integration is on our roadmap, our platform provides its own dashboards to bypass the unreliability of the Microsoft Graph reporting API. IC teams running Power BI over SharePoint frequently see different KPI values in Power BI than in native SharePoint on the same data. Our honest guide on SharePoint analytics with Power BI details these API limitations further.
- Live Attendance Trends: Track peak concurrent viewers during the live broadcast to evaluate immediate reach[1].
- Real-Time Interaction: Measure active chat comments, questions asked, and emoji reactions to assess audience sentiment.
- Audience Segmentation: Filter viewership by office location, department, or tenure to identify disconnected groups.
- Unlimited History: Compare current town hall participation with historical campaigns, bypassing the standard six-month native cap.
| Metric Feature | Native Microsoft Analytics | Analytics for Viva Engage |
|---|---|---|
| Data History | Capped at 6 months | Unlimited historical data for long-term trends |
| Audience Segmentation | No default AD or HR filters | Full department, location, and custom HR file integration |
| Multi-Channel Context | Siloed to a single platform | Fully integrated into your cross-channel communications dashboard |
Analyse video drop-off curves and watch rates on Microsoft Stream
Moving beyond basic play counts is essential for any internal communications team running large-format video and town hall communications in Microsoft 365. High view numbers can be highly misleading, as they only tell you that an employee clicked play, not how much of the content they actually consumed. To understand the true impact of your video strategy, you must analyse drop-off curves and watch rates on Microsoft Stream, which reveal exactly where employee attention spikes or fades.
By default, video analytics in Microsoft Stream offer viewer retention charts that track the specific percentage of viewers at every second of a video’s runtime[2]. These charts let you identify the exact moment your audience loses interest, whether that is during a dry financial slide or a long transition between speakers. Conversely, small spikes in the retention curve often highlight popular content, such as employee Q&A sessions or visual product demonstrations.
Turn drop-off data into actionable communications
Understanding precisely where employee attention fades empowers you to refine future town hall agendas and video lengths. Instead of relying on guesswork, you can make data-driven decisions to keep your videos concise and high-impact. For example, if your team notices a sharp drop-off after the ten-minute mark, you can adapt your strategy by placing critical announcements at the very beginning or breaking long-form videos into shorter, digestible updates. Connecting these video metrics with wider communications helps you measure employee engagement as a unified cross-channel strategy.
However, relying solely on native Microsoft reporting can leave significant blind spots. For instance, native systems cap your data history at 6 months, making year-over-year benchmarks impossible without tedious manual downloads native analytics limits. Furthermore, native tools keep video data isolated from your other channels, forcing you to manually piece together information from SharePoint, Viva Engage, and Teams. Unlike collaboration-focused platforms like Swoop Analytics that measure organisational networks, Tryane specialises specifically in comprehensive internal communication measurement. Our specialised solution, Analytics for Viva Engage, helps you track town hall communications and social video reach, overcoming the gaps of basic Viva Engage analytics. By pulling these channels into our all-in-one platform, Communication Insights, you gain a centralised, cross-channel view of your metrics with unlimited history, allowing you to track video engagement right alongside your email newsletters, SharePoint intranet, and Microsoft Teams channels.
Integrating video and town hall analytics with the rest of your intranet measurement often presents technical hurdles for digital workplace teams. Many IC departments attempt to build custom analytics in Power BI, but the Microsoft Graph reporting API is not always reliable, occasionally displaying odd KPI values or missing days of data. In fact, teams running Power BI over SharePoint frequently see different KPI values in Power BI than in native SharePoint on the same data. To solve this, Tryane provides its own robust dashboards with executive-ready templates that ensure consistency, though we have a direct Power BI integration on our roadmap as well.
Because town halls and leadership videos often cover highly sensitive corporate information, security and compliance are paramount for IT managers. Tryane is SOC 2 Type 2 certified and GDPR compliant by design, hosted in the EU by default with data residency in the United States available on demand. The entire solution deploys in a couple of hours using secure single sign-on (SSO) via Azure AD or Entra ID plus a straightforward channel connection, giving you immediate access to strategic insights without security risks.
- Identify critical drop-off points to spot where employees lose interest during long presentations.
- Refine town hall agendas by placing the most important messages within the first few minutes.
- Highlight engaging content segments by monitoring peaks in the retention curve, such as Q&A segments.
- Map engagement back to specific departments or regions using Active Directory audience segmentation.
Segment your audience to measure town hall reach by department and region
When you broadcast a large-format video or host a live town hall on Microsoft Stream and Viva Engage, you expect your strategic messages to resonate across the entire business. However, relying on standard high-level metrics like total views or basic attendee counts can leave you in the dark. Without detailed audience breakdown, your internal communication campaigns remain a black box. You cannot tell whether a low participation rate is a company-wide issue or isolated to a specific region, office, or line of business.
Leverage Active Directory and HR data for targeted insights
To move past generic play counts, we need to analyse who is actually watching. While Microsoft provides basic live-event telemetry, these native town hall insights are typically limited and often disappear after 28 days[3]. By overcoming these native analytics limitations, you can integrate your Active Directory or a custom HR file import to automatically segment your viewers. This integration allows you to instantly filter live attendance, on-demand views, and exact drop-off curves by department, country, and seniority level.
- Departmental participation: See if engineering or sales is missing from your live town hall broadcasts.
- Geographic reach: Evaluate how your message is received across global offices, ensuring your European and North American teams are equally engaged.
- Seniority alignment: Track whether mid-level managers are viewing the strategic updates they are responsible for cascading to their teams.
- Historical tracking: Analyse these segments over time without worrying about the native 6-month cap on historical data.
At Tryane, our mission is to help you stop sending messages into a black box. With our dedicated tool, Analytics for Viva Engage Viva Engage analytics, we combine your video metrics with other channels to give you an all-in-one, cross-channel single view. It takes only a couple of hours to deploy using SSO via Azure AD or Entra ID, and it remains fully GDPR compliant and SOC 2 Type 2 certified. This means you can focus on building executive-ready reports that show leadership exactly how your town halls are driving organisational alignment.
Address the native reporting gaps and Power BI data inconsistencies
When you present internal communication metrics to your leadership team, your credibility relies entirely on the accuracy of your data. However, if your team has spent hours building custom dashboards, you have likely run into a frustrating reality: Microsoft native dashboards and custom Power BI builds frequently disagree on the same basic metrics[4]. These discrepancies stem from the fact that the Microsoft Graph reporting API is not always reliable. IC teams running custom dashboards over SharePoint regularly observe occasional days of missing data or odd key performance indicator (KPI) spikes, leading to an environment where your SharePoint metrics do not match your Power BI results. When executive stakeholders spot these contradictions, it erodes their trust in your reporting.
Trying to bypass these limitations by developing in-house reporting is a major drain on internal IT resources. Instead of focusing on communication strategy, your team gets bogged down troubleshooting API synchronization delays and data pipeline failures. This is why attempting custom builds often becomes more of a technical burden than a strategic asset. To understand why these gaps occur, we must look at how data is stored. Microsoft native analytics only offer up to 180 days of history before the data is permanently deleted, creating severe Power BI limitations when designing long-term reports. This six-month limit makes it impossible to evaluate year-over-year trends, analyse the long-term impact of town hall campaigns, or build a historical benchmark for your video content. If you rely solely on built-in tools, you will also face restrictions in tracking audience participation because of native Viva Engage limitations.
| Reporting Dimension | Native M365 Dashboards | Custom Power BI Builds | tryane Communication Insights |
|---|---|---|---|
| Data Reliability | Basic metrics, but subject to reporting API delays | Frequent discrepancies with native dashboards | Fully validated, clean, and aggregated data |
| Audience Segmentation | No native HR file integration | Requires complex custom coding and manual AD sync | Seamless Active Directory and HR file import |
| Data History Retention | Strict 6-month limit (180 days) | Depends on custom cloud storage costs | Unlimited historical data retention |
| Implementation Effort | Instant, but highly fragmented | Months of development and ongoing maintenance | Deploys in a couple of hours |
Choose an all-in-one platform built for data accuracy
To build a truly reliable, executive-ready communication strategy, you need to break down data silos and stop wasting time on manual data cleanup. At tryane, our mission is to empower internal communicators with Communication Insights, an all-in-one platform that connects all your channels into a single cross-channel view across SharePoint, Viva Engage, Microsoft Teams, and internal newsletters. Rather than battling erratic custom databases, you can access clean, aggregated metrics that are ready for senior leadership. While a native Power BI integration is on our technical roadmap, tryane provides its own dedicated dashboards with executive-ready templates that ensure your data remains consistent and trustworthy for executive reporting purposes.
Security, compliance, and ease of deployment are also critical factors when introducing any new software to your digital workplace. Our software is SOC 2 Type 2 certified and GDPR compliant by design, giving your IT and security teams complete peace of mind. By default, our hosting is located in the EU, though we also provide secure data residency in the United States on demand. Best of all, tryane deploys in just a couple of hours using secure single sign-on (SSO) via Azure AD or Entra ID alongside a direct channel connection. This simple setup allows you to immediately start analysing drop-off curves, live attendance, and deep audience segments without waiting weeks for custom development.
Consolidate video analytics into a unified cross-channel communication dashboard
When you run large-format video and town hall communications, it is easy to feel like you are sending your messages into a black box. You can see how many times a video was played, but these fragmented play counts do not show how video fits into your overall cross-channel strategy. To improve your impact and make data-driven decisions, you need an all-in-one view that connects video performance with the rest of your internal communications.
Understand your audience reach beyond basic play counts
While Microsoft Teams provides basic town hall attendance reports that detail when users joined and left[5], these reports lack the deeper context internal communicators need. You cannot easily see drop-off curves, understand live attendance trends, or measure reach across specific internal groups. By leveraging Analytics for Viva Engage and Analytics for SharePoint, you can overcome these limits. Our platforms help you access deep behavioural metrics and offer unlimited history, bypassing the standard six-month cap that restricts Viva Engage native analytics.
| Capability | Microsoft Native Dashboards | Tryane Communication Insights |
|---|---|---|
| Cross-Channel Views | Siloed by tool (Stream, SharePoint, and Teams are separate) | Single, unified dashboard for all channels |
| Data Retention | Limited to six months for native Viva Engage reporting | Unlimited history for long-term trend analysis |
| Audience Segmentation | Basic or unavailable in standard views | Deep segments via Active Directory or HR file imports |
Eliminate manual reporting and make data-driven decisions
Many internal communication teams waste hours compiling metrics from SharePoint intranets, email newsletters, Teams channels, and Stream videos into manual reports. If you have considered building custom dashboards with Power BI to automate this, you should be aware of the technical challenges. The Microsoft Graph reporting API is not always reliable, occasionally leading to odd KPI values or missing days of data. In fact, internal communication teams running Power BI over SharePoint frequently see different KPI values in Power BI than in native SharePoint on the same data. Tryane provides its own robust dashboards with executive-ready templates: and while a native Power BI integration is on our roadmap, we allow you to bypass these API headaches entirely today.
With Communication Insights, you can integrate your Stream and Viva Engage metrics into a single, unified internal communications dashboard. This gives you a clear cross-channel single view across SharePoint, Viva Engage, Microsoft Teams, and internal newsletters. Unlike tools like Swoop Analytics that focus heavily on organisational network benchmarking, we prioritise helping you understand exactly how your communication campaigns land with your employees. We designed our solutions to meet the strict security compliance requirements of IT leaders. Tryane is SOC 2 Type 2 certified and GDPR compliant by design, hosted in the EU by default with US data residency available on demand. You can deploy it in a couple of hours using secure single sign-on via Azure AD or Microsoft Entra ID and start segmenting your audience via Active Directory or HR file imports immediately.
Frequently asked questions
How does Microsoft Stream track video views?
Microsoft Stream tracks video performance using three core metrics: total views, unique viewers, and average watch rate. These are available at both the individual video level and the site level in SharePoint.
Can I see live attendance for Viva Engage town halls?
Yes, Viva Engage town halls powered by Microsoft Teams support real-time attendance tracking, showing live viewer counts, country-level locations, and presenter metrics as the broadcast happens.
What is a video drop-off curve and why does it matter?
A drop-off or retention curve maps employee viewership across every second of a video. It reveals exactly where interest declines, helping internal communicators refine content lengths and formats.
Why do Power BI and native SharePoint metrics sometimes disagree?
This discrepancy occurs because the Microsoft Graph reporting API can be unstable, leading to missing data or erratic KPI values when custom dashboards process the feed differently than native SharePoint.
How can we segment our town hall audience?
Audience segmentation is typically achieved by connecting your reporting system to Active Directory or importing an HR file, allowing you to break down live and on-demand views by department or region.
Sources
Further reading
• Measuring cross-channel internal communications
• Audience segmentation for internal communications
• The five internal communication KPIs that show your IC is working
• Measuring frontline worker communications
Tryane offers a 15-minute review of how your internal communications are measured today, and what a defensible reach figure would take. Book a slot with Jérémy.