
In short
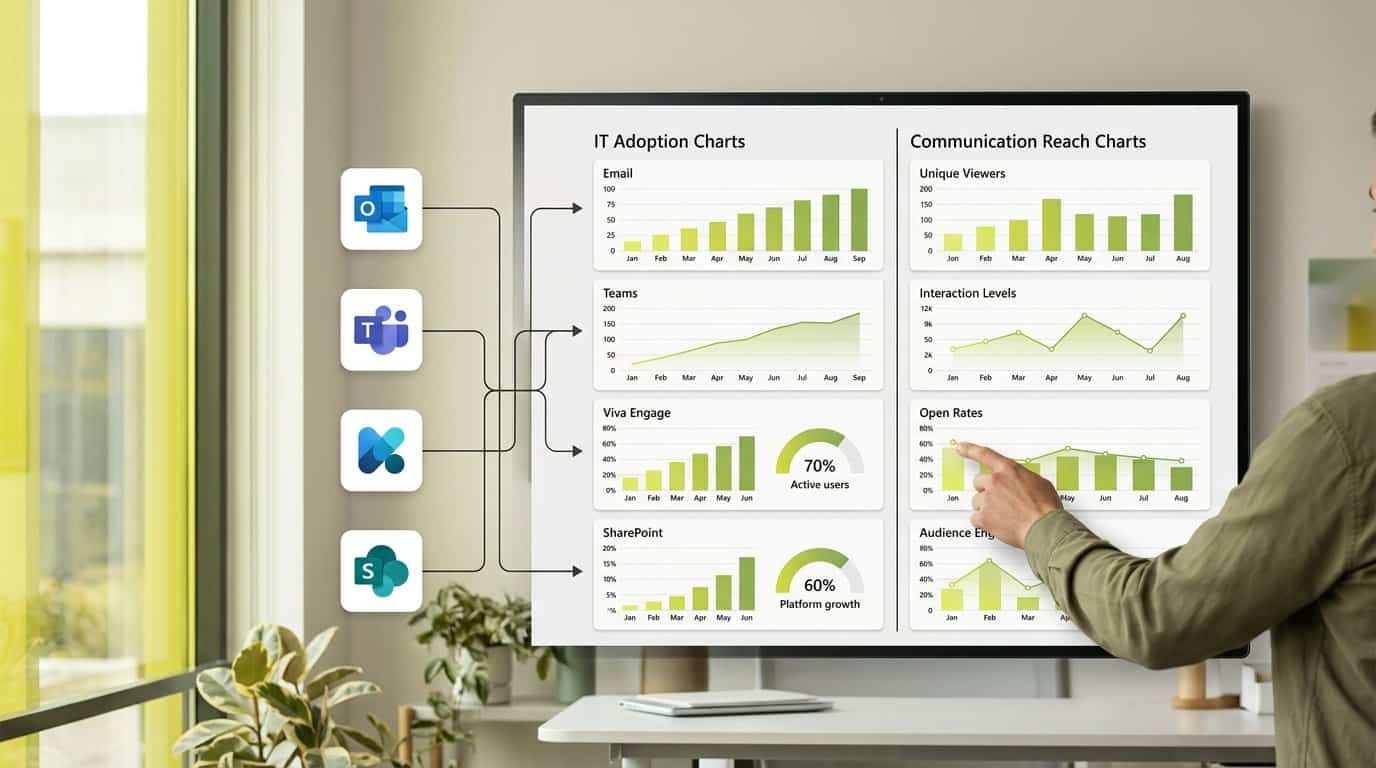
Microsoft 365 gives IT three reporting layers: admin center usage reports, the Power BI usage analytics app and Adoption Score. They show how workloads are adopted, not whether a message reached its audience. We break down what each report covers, where segmentation stops, and what comms teams need instead.
Key takeaways
- Adoption Score tops out at 600 points since Technology experiences retired in January 2026, down from 900.
- The Communication score counts people using two or more of Exchange, Teams and Viva Engage over 28 days, at organization level only.
- Usage analytics shows 12 months of data, but user-level detail exists only for the latest complete calendar month.
- Admin center usage reports hide user, group and site names by default, which blocks department and country segmentation.
- Usage analytics pivots by Active Directory attributes (location, department, organization), but none of this measures whether a specific message landed.
Three Microsoft 365 reports, three different jobs
When a comms colleague asks you how many people read the latest CEO post, the conversation usually ends up in the Microsoft 365 admin center. That is where the mismatch starts. Microsoft 365 ships three native reporting layers, and each was built to answer a different question: which services people use, how adoption trends move over a year, and where your organization stands on its transformation journey. None of them was designed to trace one message to one audience. Knowing which layer answers which question is the fastest way to stop comms requests from landing on the wrong report.
| Report | What it shows | Reporting window | Built for |
|---|---|---|---|
| Admin center usage reports | Per-service activity, for example email, Teams and SharePoint usage | Last 7, 30, 90 or 180 days[1] | IT adoption and licensing decisions[1] |
| Microsoft 365 usage analytics (Power BI template app) | A prebuilt cross-product dashboard you can customize and share | Last 12 months, with user detail for the latest complete calendar month[2] | Adoption analysis, pivotable by region or department[2] |
| Adoption Score | Organizational transformation metrics across categories such as Communication and Teamwork | 28-day and 180-day views[3] | Digital transformation tracking[3] |
Access differs as much as purpose. Admin center usage reports require one of the roles Microsoft lists, from Global Administrator down to Reports Reader, and the Usage Summary Reports Reader role sees the reports with no user details[1]. Adoption Score lives only in the Microsoft 365 admin center under Reports > Adoption Score, behind its own role list[3]. The Power BI template app has to be enabled before data collection even starts[2].
This is why comms requests keep arriving on your desk pointed at the wrong tool. A request like 'did the news post reach Sales in Germany' gets routed to the Teams activity report, which counts messages sent and files accessed, not readers of a specific post. Each layer answers an IT question well. Your job as the Digital Workplace or IT manager is to recognize when the question behind the request is one none of the three can answer, and to know where that answer actually lives.
The Power BI usage analytics template app is the layer most often offered to comms as 'the analytics solution', because it looks like a dashboard and it pivots by department. Before you set that expectation with your comms team, be precise about what the app holds and where its limits sit.
- Most reports show the last 12 months of data, and month values always refer to the latest complete month unless stated otherwise[2].
- User-specific information is available only for the latest complete calendar month[2].
- The data model includes Active Directory attributes such as location, department and organization, so certain reports can be pivoted by region or department[2].
- Starting in March 2026, the Company, City and ProxyAddresses field filters in the User Activity tab are no longer supported. To keep filtering activity data by those attributes, Microsoft directs you to join Microsoft 365 usage report Graph API metrics with your own data sources and build a custom dashboard in Power BI or another visualization tool[2].
Read those four points together and the practical limit appears. Your comms team can watch how email, Teams and Viva Engage activity moved across a year, and slice some reports by department or location. What they cannot do is follow a campaign: the user-level slice resets every month, so a newsletter sent in March cannot be traced to its readers in June. The Graph API route that replaces the retired filters is a developer project, not a report you hand to a communications manager.
If a comms colleague quotes an Adoption Score from last year's review, the scale they are comparing against no longer exists. Microsoft changed the score in early 2026, and anyone reading the report needs the new arithmetic before they interpret a number.
- Starting January 22, 2026, the Microsoft 365 admin center retires the Technology experiences score and its three categories: Network connectivity, Microsoft 365 Apps health and Endpoint analytics. The change rolls out and completes in February 2026[3].
- After the change, the overall Adoption Score equals the People experiences score, and Microsoft's documentation states that the maximum possible score changes from 900 to 600[3].
- Five categories remain, each weighted equally at 100 points: Communication, Meetings, Content collaboration, Teamwork and Mobility. AI Adoption adds a sixth category worth 100 points if Microsoft Copilot licenses are enabled[3].
- All insights are calculated using data at the organizational level, not the individual level[3].
Two consequences for your stakeholder conversations. First, a total that drops by up to 300 points between reports is a scale change, not a collapse in engagement, so say so before someone escalates it to your leadership. Second, the score measures whether people use several workloads in combination, not whether a specific message reached the people it was meant for. The Communication category is where your comms team will read the report first, so it deserves a closer look.
What the Communication score really measures
Communication is the Adoption Score category your comms team will quote first, so make sure everyone in the room reads it the way Microsoft defines it. The definition is narrower than most people assume.
The key metric is the percentage of people using two or more communication modes: sending emails through Exchange, sending messages through Teams, and posting on communities in Viva Engage. The numerator counts people who used more than one of those modes in the last 28 days; the denominator counts people enabled for more than one communication product in the last 28 days[4]. The trend chart tracks that numerator across the last 180 days, with each daily value aggregating the previous 28 days[4].
Scores are not provided at the individual user level. The communication score measures, at aggregate organizational level, whether people consistently communicate using multiple modes among email, chat and community posts over a 28-day window[4].
Now the part that matters for your comms stakeholders: this is a measure of mode flexibility, not message outcomes. A department can score highly on channel variety while a critical benefits announcement goes unread there, because the score never looks at a specific message or a specific audience. Counting the messages a tenant sends is not the same as measuring who read what, which is the gap between adoption counts and message reach that the guide to measuring internal communications on Microsoft Teams describes in detail.
Where department and country views stop
Even where a report exists, its default privacy design blocks the segmentation comms is asking for. This is the boundary you will hit most often, so know it precisely before you promise a department-level view.
- Admin center usage reports conceal user, group and site names by default, so report readers see anonymized rows unless an admin changes the setting[1].
- Two of the roles that can view usage reports, Usage Summary Reports Reader and User Experience Success Manager, get no user details at all[1].
- Even with names revealed, user-level detail in usage analytics exists only for the latest complete calendar month[2], which breaks any longitudinal department or country tracking.
Put yourself in the comms manager's position. They want to know reach among frontline staff at one site, trended over six months, compared with last year's campaign. The native reports cannot produce that, even with your full cooperation, for the three reasons listed above. The design is deliberate and sensible for a tool built to answer IT questions; it simply is not an audience measurement tool. If comms keeps pulling SharePoint usage reports hoping to find audience data in them, the guide to maps what each native report holds and what it still misses.
How do you measure message reach by audience?
The gap is now easy to state. The three reports above answer IT's questions about workloads and adoption trends. What comms is asking for is a different dataset altogether: who read this message, in which department, country or role, and what they did next. No native report joins message-level events with audience attributes over time, so that second question needs its own data layer.
- Message-level reach and engagement, segmented by department, country, language and role, so comms can see whether a campaign landed with the audience it targeted.
- Trend lines that persist month over month, so a campaign can be compared with the one before it instead of resetting every calendar month.
- A route to build it yourself: joining Microsoft 365 usage report Graph API metrics with your own data sources in Power BI, the path Microsoft names once the User Activity filters retire[2].
Be honest with comms about the build-it-yourself option. Power BI can ingest usage data through the Microsoft Graph API, but it requires significant engineering setup, and Microsoft provides no pre-built dashboards for internal communication use cases. You would be signing your team up to build and maintain a custom data model, not handing over a report.
The gap is not unique to your tenant. In Tryane's Digital Workplace Benchmark 2026, an assessment based on in-depth demonstrations, expert interviews and analysis of publicly available data, SharePoint received an Analytics score of 45%, the lowest score any of the 12 platforms profiled received in any category. Download the full to compare the platforms by category. And if you are weighing Microsoft native analytics against a build-your-own Power BI approach and dedicated third-party platforms, the buyer's guide for 2026 walks through that comparison option by option.
You do not need to choose between the native layers and what comms is asking for. Keep the admin center usage reports for licensing and capacity questions, and keep the Adoption Score for transformation tracking[3]. Those are IT instruments, and they answer IT questions well. The missing layer is comms' own: message-level reach by audience, held separately from your adoption reporting rather than squeezed into it.
That is what Communication Insights is for. It is an all-in-one cross-channel analytics platform that connects email newsletters, the SharePoint intranet, Viva Connections and Viva Engage into one central dashboard, so your comms team sees who read a message, in which department, country and role, and how that audience engaged over time. We built it so both teams work from the same tenant without competing for the same reports: IT keeps its native adoption view, and comms gets the audience-level evidence the native reports cannot produce.
If you want to see what message-level reach looks like on your own tenant, book a 30-minute call with Jérémy and we will walk through how Communication Insights adds message-level reach to your Microsoft 365 usage data.
Frequently asked questions
What is Microsoft 365 usage analytics?
It is a prebuilt Power BI template app that gives a cross-product view of how your organization adopts Microsoft 365 services. Most reports show the last 12 months of data, while user-specific information is available only for the latest complete calendar month. The underlying data model includes Active Directory attributes such as location, department and organization, so some reports can be pivoted by region or department.
What is the difference between usage reports, usage analytics and Adoption Score?
Admin center usage reports show per-service activity over the last 7, 30, 90 or 180 days and help with licensing decisions. Usage analytics is the Power BI template app with a 12-month cross-product view. Adoption Score is a separate report in the admin center that quantifies organizational progress across categories like communication, meetings and teamwork, with a maximum of 600 points since January 2026.
What is the maximum Microsoft Adoption Score in 2026?
The maximum possible Adoption Score is 600 points. It changed from 900 to 600 when the Technology experiences score and its three categories (Network connectivity, Microsoft 365 Apps health, Endpoint analytics) were retired from the admin center starting January 22, 2026, a change that completed in February 2026. The overall score now equals the People experiences score.
What does the Communication score in Adoption Score measure?
It measures the percentage of people in your organization using two or more communication modes, namely sending emails through Exchange, sending messages through Teams, and posting on communities in Viva Engage, within a 28-day window. Scores are calculated at an aggregate organizational level only and are not provided at the individual user level. It measures mode flexibility, not whether a specific message reached its audience.
Why do Microsoft 365 usage reports show anonymous names?
Usage reports in the Microsoft 365 admin center conceal user, group and site names by default to protect individual privacy. A Global Administrator can change this setting to reveal identifiable details, and some reader roles such as Usage Summary Reports Reader never see user details at all. Microsoft also publishes a troubleshooting page explaining the anonymous-names behaviour.
Can I see Microsoft 365 usage by department or country?
Partly. The usage analytics data model includes Active Directory attributes (location, department and organization), enabling pivots by region or department in certain reports. However, user-level detail is available only for the latest complete calendar month, and starting in March 2026 the Company, City and ProxyAddresses field filters in the User Activity tab are no longer supported, which limits sustained department and country segmentation.
Does Adoption Score tell me if employees read my internal communications?
No. All Adoption Score insights are calculated using data at the organizational level, not the individual level, and the Communication category only counts how many people use multiple communication modes over 28 days. It says nothing about whether a specific campaign, newsletter or news post reached the departments, countries or roles it targeted. Measuring message-level reach by audience requires cross-channel analytics alongside these native reports.
Sources
Further reading
• Viva Connections Analytics: How to Measure Intranet Adoption in Microsoft 365
• Viva Engage and Microsoft Teams: Two Surfaces, Two Different Things You Can Measure
• The annual internal communications report: a template for the C-suite
• Analytics for Microsoft 365: What an Internal Communication Team Actually Needs
If you want to see what cross-channel reporting looks like against your real data, Tryane runs a 15-minute walkthrough with no slides. Book a slot with Jérémy.