In short
Traditional internal comms metrics fall short in a hybrid world. To bridge the gap between policy intent and lived experience, IC leaders must segment analytics by location type, measure channel fit per population, and move beyond generic averages.
Key takeaways
- Generic communication averages hide severe misalignment, with only of employees feeling fully aligned with business goals
- Ineffective communication is costly, draining up to 35 working days per employee annually in lost productivity.
- True channel fit requires location-based segmentation, analyzing how office, hybrid, and remote teams engage with specific platforms.
- A unified, cross-channel dashboard is essential to track SharePoint, newsletters, and Viva Engage in one central view.
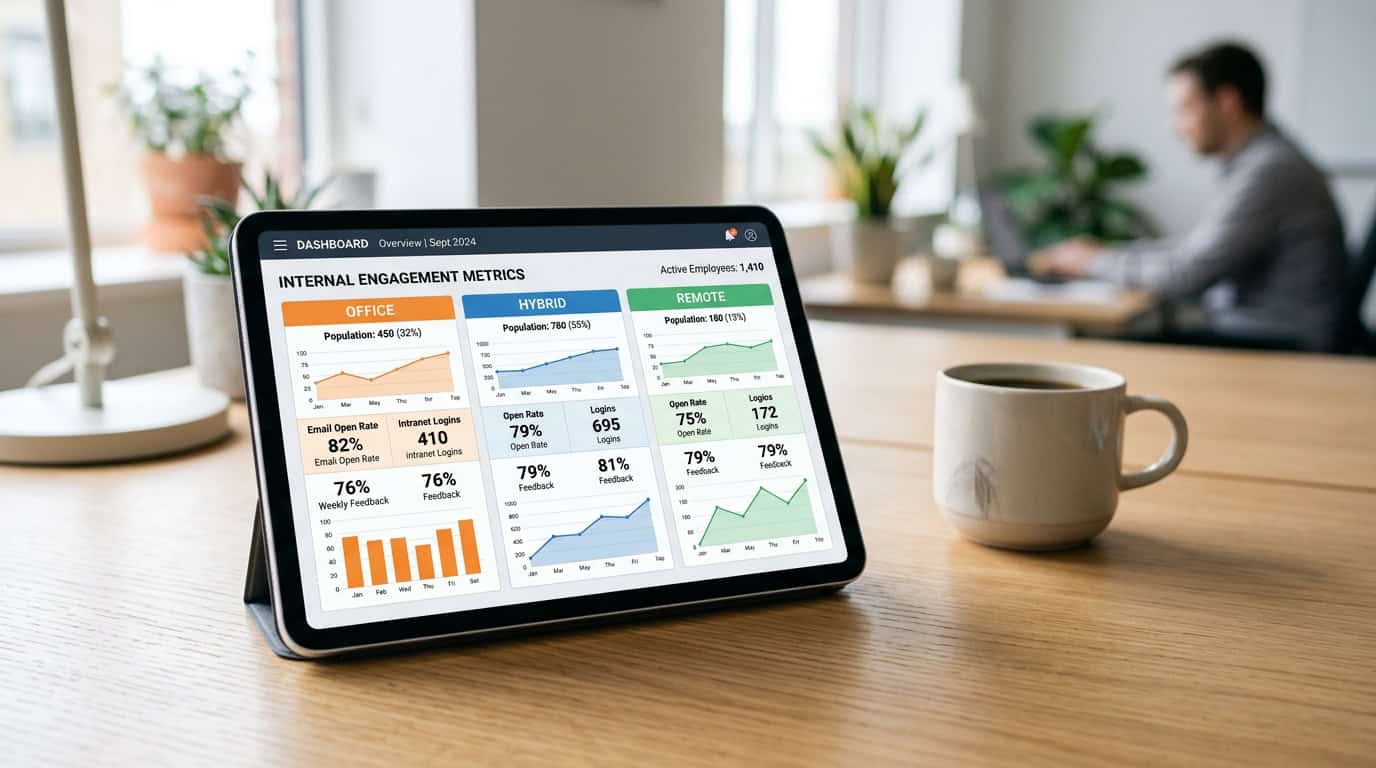
Segment your audience: Why location-based data is the new baseline
When you review your internal communication metrics at the end of the month, a single aggregated reach or read rate can be incredibly misleading. For organisations with a mix of office-based, hybrid, and fully remote employees, looking at global averages hides critical engagement gaps. A corporate announcement might show a healthy 75% read rate overall, but this number often masks a dangerous disconnect: high engagement among on-site staff who hear about it by word of mouth, compared to absolute silence from remote workers who feel increasingly isolated. To measure the true impact of your internal campaigns and bridge the gap between your policy intent and the lived experience of your staff, you must segment your employee engagement data by location type.
The differences between these workplace populations are more than just geographical: they represent entirely different experiences of organizational culture. According to a global workplace study by Gallup, fully remote employees report a 31% engagement rate, whereas hybrid and on-site remote-capable workers both sit at a lower 23% engagement rate[1]. At the same time, remote employees are significantly more susceptible to feelings of loneliness and disconnect, meaning your communications are their primary, and sometimes only, lifeline to the company. When you group these distinct segments into a single reporting bucket, you miss these local dips in engagement. You cannot address a problem you cannot see, which is why location-based data is no longer a luxury but the new baseline for strategic internal communications.
Map your communication channels to distinct workspace personas
Once you recognize that office-based, hybrid, and fully remote workers consume information differently, you can start tracking channel fit for each group. For instance, your hybrid workers might rely heavily on Microsoft Teams on their remote days, while office workers interact more with SharePoint intranet kiosks, and remote teams depend on Viva Engage and email newsletters. Relying on basic SharePoint native analytics makes it difficult to compare these habits because the data is trapped in separate silos. To build a cohesive, cross-channel strategy, you need to understand how each specific demographic group navigates your digital ecosystem and identify which channels actually drive action for each population.
- Map engagement by location type to identify whether remote employees are missing critical corporate updates.
- Identify channel preferences for hybrid workers to ensure you are publishing news on the platforms they use most on their home days.
- Track read-time behaviors and active hours to avoid sending major announcements during periods of high digital fatigue.
- Compare activity trends over time to spot when a specific office location or remote team is showing signs of communication disengagement.
At Tryane, we designed Communication Insights to make this complex segmentation simple and stress-free. Instead of spending hours manually merging spreadsheets, our platform integrates directly with your Azure Active Directory or Entra ID, and supports custom HR file imports to automatically group your employees by their work location. This allows you to generate a single, cross-channel view of your communication performance across SharePoint, Viva Engage, Microsoft Teams, and newsletters without any manual effort. With our GDPR-compliant, SOC 2 Type 2 certified analytics that deploy in just a couple of hours, you can stop guessing how your remote and hybrid populations are responding and start making data-driven decisions to support them.
Measure channel fit: Aligning platforms with work patterns
In organizations with a mix of office-bound, hybrid, and fully remote employees, a one-size-fits-all communications strategy fails to deliver. When you publish a critical update, you cannot assume every employee engages with it in the same way. According to Gallup, more than 50% of remote-capable employees operate in a hybrid model, split between their homes and corporate offices[2]. This distributed workforce creates distinct information-consumption habits. While office-based workers might casually browse your SharePoint intranet during their lunch break, remote staff often rely heavily on Microsoft Teams notifications or email newsletters to stay updated. Without deep, segmented data, you are sending your campaigns into a black box, unable to see if your channels actually fit your people’s lived work patterns.
Identify channel preferences by worker segment
To build an effective digital workplace, you must track exactly where your different audiences spend their attention. We at tryane believe that measuring engagement should not be a guessing game. By segmenting your workforce using your existing Active Directory or an HR file import, you can analyze channel fit with absolute precision. For instance, you might discover that your hybrid sales team has high engagement on mobile-friendly internal newsletters, whereas your fully remote engineering team lives entirely in Microsoft Teams. Recognizing these differences allows you to adapt your content distribution, ensuring that vital corporate announcements are pushed to the specific platforms where each segment is most active.
| Employee Segment | Primary Active Channels | Typical Engagement Habit | Key Metric to Track |
|---|---|---|---|
| Office-Based Staff | SharePoint and Viva Engage | Asynchronous reading during desk hours | Page views and social replies |
| Hybrid Employees | Microsoft Teams and Email Newsletters | Quick scans on mobile or remote days | Read rate and link click-throughs |
| Fully Remote Workers | Microsoft Teams and SharePoint | Direct search and targeted channel alerts | Interactive reactions and read receipts |
Unify your metrics into a single cross-channel view
A major frustration for internal communicators is the siloed nature of platform analytics. If you rely on native tools, you are forced to jump between disparate dashboards, attempting to reconcile different reporting periods and mismatched metrics. You will quickly run into SharePoint native analytics limits, which restrict your historical data to a mere six months and prevent any meaningful audience segmentation. To truly understand channel fit, you need a single cross-channel view. Our all-in-one software, Communication Insights, solves this by pulling data from SharePoint, Viva Engage, Microsoft Teams, and newsletters into one centralized hub. It deploys in just a couple of hours using secure single sign-on (SSO) via Azure AD or Entra ID, giving you an immediate, unified view of your entire internal marketing funnel.
By combining these sources, you can easily track the performance of a single campaign across every touchpoint. For example, if you are measuring Teams engagement alongside intranet activity, you can see if a post on a Teams channel drove more remote-worker traffic to SharePoint than a newsletter link did. This lets you stop wasting time on underperforming channels and double down on what works. Rather than trying to build complex, custom dashboards in Power BI, which can suffer from inaccurate Microsoft Graph reporting APIs and conflicting KPI values when compared to native SharePoint data, you can rely on tryane’s built-in executive-ready templates.
We know that data privacy is a top priority for digital workplace leaders. That is why tryane is SOC 2 Type 2 certified and compliant with GDPR regulations by design. Our platform is EU-hosted by default, with secure data residency in the United States available on demand, ensuring your employee metrics remain safe and fully compliant. With an unlimited data history, you can track seasonal trends and long-term behavioral shifts year over year, moving far beyond the six-month native caps. This secure, comprehensive insight empowers you to align your channels with employee habits, ensuring your communication strategy is both efficient and highly impactful.
Track the gap: Policy intent vs. employee lived experience
When leadership designs a hybrid work policy, a restructure, or a strategic shift, they often assume their message is clear. However, there is a stark disconnect between policy intent and employee reality. According to recent industry research, 80 percent of leaders believe their internal communications are clear and engaging, yet only 50 percent of employees agree[3]. This disconnect results in a severe alignment gap: while 27 percent of executive leaders believe their staff are entirely aligned with the organization’s goals, a meager 9 percent of employees feel the same way[3]. For internal communications leaders, closing this gap requires more than just repeating the message. You must track how updates are digested across different employee cohorts.
To measure the lived experience of your employees, we must move past basic, vanity metrics like simple page views or email opens. An open rate only tells you that a post was clicked, not that it was read or understood. Shifting to deeper employee engagement analytics helps you evaluate reading depth and active participation, indicating whether key strategic directives are actually sinking in. By evaluating these metrics, we can identify which populations are missed entirely and who is experiencing digital fatigue, allowing us to actively improve our impact.
Segment your audience to find hidden disconnects
In a distributed organization, a single generic communication channel strategy does not work. Fully remote workers rely on digital hubs, office-based teams depend on local meetings, and hybrid staff float in between. To make your internal communication more efficient, you must analyze channel fit per population. By using our Communication Insights platform, you can segment your audience by location type (such as office, hybrid, or fully remote) using Active Directory metadata or a simple HR file import. This allows you to evaluate engagement levels across these distinct populations and identify where policy alignment is failing.
- Compare readership depth: Contrast the reading time of remote employees with office-based workers to see if long-form updates are being bypassed.
- Measure channel preference: Identify whether hybrid employees respond better to news on SharePoint or conversations on Viva Engage.
- Track interaction rates: Monitor how different locations participate in discussions to see if fully remote staff feel disconnected from the central corporate culture.
- Identify policy blind spots: Spot which departments or regions are lagging in key campaign adoption.
Present clear alignment insights to corporate leadership
To earn budget and influence business decisions, communications professionals need to share these insights with the board. Tryane provides its own dashboards with executive-ready templates, making it simple to present high-level trends rather than operational minutiae. Our templates deliver a consolidated, cross-channel single view across SharePoint, Viva Engage, Microsoft Teams, and internal newsletters. While we have a Power BI integration on our product roadmap, our native dashboards offer immediate value. They help you avoid the technical headaches often associated with building SharePoint analytics with Power BI, where the Microsoft Graph reporting API is not always reliable, resulting in occasional missing days of data or inconsistent KPI values compared to native systems.
By shifting to dedicated, cross-channel analytics, you can deliver a board pack that clearly shows how policy intent translates into employee experience. Our platform deploys in a couple of hours with secure SSO via Azure AD or Entra ID alongside a simple channel connection. Built with enterprise security in mind, Tryane is SOC 2 Type 2 certified and GDPR compliant by design, with EU hosting by default and US data residency available on demand. With unlimited data history to help you benchmark long-term alignment trends, you can easily bypass native caps that limit history to six months. Ultimately, tracking this alignment gap with objective data empowers you to adapt your strategy, improve your impact, and make data-driven decisions that unify your distributed workforce.
Overcome native reporting limits: The path to a unified cross-channel view
Managing internal communications in a hybrid organization requires a precise understanding of how different populations interact with your messaging. Whether your employees are office-bound, hybrid, or fully remote, each segment has unique communication habits. However, compiling these insights across different platforms is a massive challenge. When you rely on siloed dashboards, you miss the bigger picture of how your digital workplace is performing. To measure channel fit per population and track the gap between policy intent and the lived experience of your employees, you need a single, cohesive analytics layer rather than a collection of fragmented reports.
Navigate native SharePoint and Viva Engage tracking limitations
Native Microsoft 365 analytics provide basic usage statistics, but they fall short when you try to perform deep strategic analysis. For instance, native SharePoint and Viva Engage usage reports cap your historical data at 180 days, meaning you lose access to historical trends after only six months[4]. If you want to compare year-over-year engagement or understand how hybrid work policies affect long-term communication trends, these limitations present a major hurdle. Communicators navigating native SharePoint analytics limits frequently find themselves manually exporting data every month to prevent permanent loss. Furthermore, native platforms lack the robust audience segmentation required to isolate engagement trends for remote, hybrid, or office-based teams, forcing you to guess how each group is responding.
Understand the reality of Microsoft Graph API and custom Power BI builds
To bypass these native limits, many organizations attempt to build custom Power BI reports by querying the Microsoft Graph reporting API. While this approach seems logical, it introduces significant technical complexity and data reliability issues. The Microsoft Graph reporting API is not always reliable, leading to occasional odd KPI values and occasional days of missing data[5]. In practice, internal communication teams running Power BI over SharePoint frequently see different KPI values in Power BI than in native SharePoint on the same data. These discrepancies can undermine the credibility of your reporting, making it difficult to present definitive metrics to leadership.
| Metric or Feature | Native Microsoft Reporting | tryane Platform |
|---|---|---|
| Historical Data | Capped at 180 days | Unlimited history (no native caps) |
| Channel Aggregation | Separate, disconnected dashboards | All-in-one cross-channel single view |
| Audience Segmentation | Very limited or manual filters | Active Directory or HR file import |
| Data Consistency | API discrepancies in custom builds | Reliable executive-ready dashboards |
To eliminate these technical headaches, tryane offers a streamlined alternative. Our platform deploys in a couple of hours using secure Single Sign-On (SSO) via Azure AD or Entra ID, combined with direct channel connections. This fast setup ensures you can establish a reliable, long-term data history without waiting months to build a custom solution. Because security and compliance are paramount for global enterprises, tryane is SOC 2 Type 2 certified and GDPR compliant by design. By default, our service is EU-hosted, though we offer data residency in the United States available on demand to satisfy local compliance requirements.
With products like Communication Insights, Analytics for SharePoint, and Analytics for Viva Engage, tryane brings your SharePoint intranet, Viva Connections, Microsoft Teams, Viva Engage, and internal newsletters into a single view. This all-in-one dashboard breaks down data silos and allows you to segment your audience using Active Directory or a simple HR file import. While a direct Power BI integration is on our product roadmap, tryane already provides its own comprehensive dashboards filled with executive-ready templates. These templates allow you to bypass native Viva Engage limits and immediately understand which channels resonate most with your remote, hybrid, or office populations, ensuring your communication strategy is always backed by solid, consistent data.
Adapt your strategy: Turn hybrid communications data into action
To lead a successful hybrid workplace, you must move beyond generic, organization-wide announcements. Internal communication is failing in ways that are measurable, with 73% of hybrid teams reporting that remote work makes communication barriers worse[6]. When employees are distributed across the office, home, and third places, a one-size-fits-all approach only contributes to digital noise. With 41% of employees juggling three or more communication channels daily[7], information fatigue is a real threat to productivity. We must adapt our strategy by segmenting audiences by location type: office, hybrid, and fully remote. By understanding the distinct digital footprint of each population, you can target messages where they actually land, rather than sending everything to everyone.
Set segment-specific KPIs for hybrid populations
Rather than applying a single benchmark, successful internal communication leaders set realistic, population-specific KPIs. For instance, office-based teams might respond better to interactive SharePoint news, whereas fully remote employees may rely more on real-time Microsoft Teams announcements or Viva Engage communities. To track this, you need a robust way to segment your audience using Active Directory or HR files. Native tools fall short here, as Microsoft native analytics do not support deep audience segmentation, and they often cap historical data at six months. Platforms like Swoop Analytics, Intlock / CardioLog, and tygraph / AvePoint offer various metrics, but they frequently lack a unified view. In contrast, our platform, Communication Insights, provides an all-in-one cross-channel view with unlimited history to help you track exactly how different locations consume information over time. Whether you require specialized Analytics for SharePoint or dedicated Analytics for Viva Engage, we ensure your data is unified into a single dashboard.
| Employee Segment | Primary Channels | Core KPI to Track | Actionable Strategy |
|---|---|---|---|
| Office-Based | SharePoint, Digital Signage, Email | Active Read Rate and Desktop Clicks | Use SharePoint intranet for deep-dive news: reserve Teams for quick updates |
| Hybrid Comms | SharePoint, Viva Engage, Microsoft Teams | Cross-Channel Reach and Engagement | Balance formal SharePoint updates with social conversations on Viva Engage to bridge the gap |
| Fully Remote | Microsoft Teams, Email Newsletters, Viva Engage | Mobile Read Rate and Interaction Frequency | Optimize newsletters for mobile and run interactive Q&A sessions on Viva Engage to drive inclusion |
Demonstrate tangible business ROI to secure leadership support
Securing budget for internal communications requires showing leadership that your efforts actively improve engagement and reduce fatigue. To do this, you must link your communications data to strategic business outcomes, which we outline in our guide on ROI calculation. While some internal communications teams attempt to build custom dashboards using Power BI over SharePoint, this route introduces significant technical hurdles. In our experience, the Microsoft Graph reporting API is not always reliable, which can lead to occasional odd KPI values or missing data. Furthermore, communication teams frequently see completely different KPI values in Power BI than in native SharePoint on the same data. Rather than wrestling with custom builds, you can use our executive-ready dashboards to produce clear, consistent reports for your board pack, which we discuss in our guide on executive reporting best practices.
Taking action on your hybrid communications data does not require a lengthy, multi-month IT project. Our platform is SOC 2 Type 2 certified and GDPR compliant by design, ensuring complete data security for global organizations. It hosts data in the EU by default, with US data residency available on demand. With a rapid deployment time of just a couple of hours, via single sign-on (SSO) through Microsoft Azure AD or Entra ID and quick channel connections, you can start tracking the gap between your policy intent and the lived employee experience almost immediately. By turning these cross-channel insights into targeted action, you can finally reduce employee information fatigue and prove the strategic value of your internal communications.
Frequently asked questions
How do you segment internal communications by location?
You can segment internal communications using your Active Directory or HR file imports to group employees into office, hybrid, and fully remote populations. This allows you to track engagement metrics separately for each group. Tryane’s Communication Insights makes it easy to apply these filters across SharePoint, Viva Engage, and Teams, so you can see exactly which channel works best for which population.
Why do leaders and employees disagree on communication clarity?
According to the Axios HQ 2025 study, of leaders think internal communications are clear and engaging, but only 50% of employees agree. This gap exists because leaders often measure success by sending volume or superficial open rates, whereas employees look for relevance and clarity. Tracking reading depth and channel fit can bridge this misalignment
How much productivity is lost to poor internal communication?
Axios HQ research shows that ineffective communication costs organizations up to 35 working days per employee annually in lost productivity. This is equivalent to an estimated $ in salary waste per employee each year. Tracking engagement by location helps internal communicators eliminate noise and recover lost hours
What are the limitations of native SharePoint analytics?
Native SharePoint and Microsoft 365 analytics suffer from short historical retention, usually capped at 6 months, and lack cross-channel correlation. Furthermore, the Microsoft Graph API can occasionally present inconsistent data, meaning custom Power BI setups often show different KPI values compared to native SharePoint. Tryane offers unlimited history and a unified cross-channel single view.
What is the best way to measure channel fit in a hybrid workplace?
Measuring channel fit involves analyzing platform engagement across specific employee segments. For instance, you track whether your remote team prefers Microsoft Teams alerts while your hybrid staff engages more with SharePoint news or email newsletters. Comparing these metrics in a centralized dashboard allows you to optimize where you publish key updates.
Sources
Further reading
• Measuring cross-channel internal communications
• Audience segmentation for internal communications
• The five internal communication KPIs that show your IC is working
• Measuring frontline worker communications