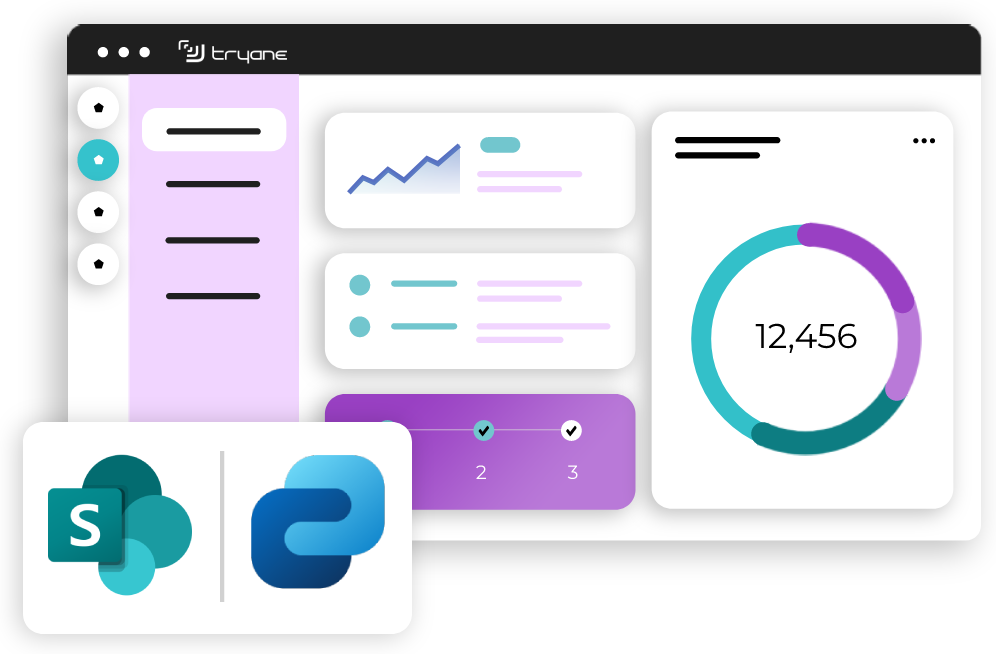
Understand the behavior of your employees on SharePoint
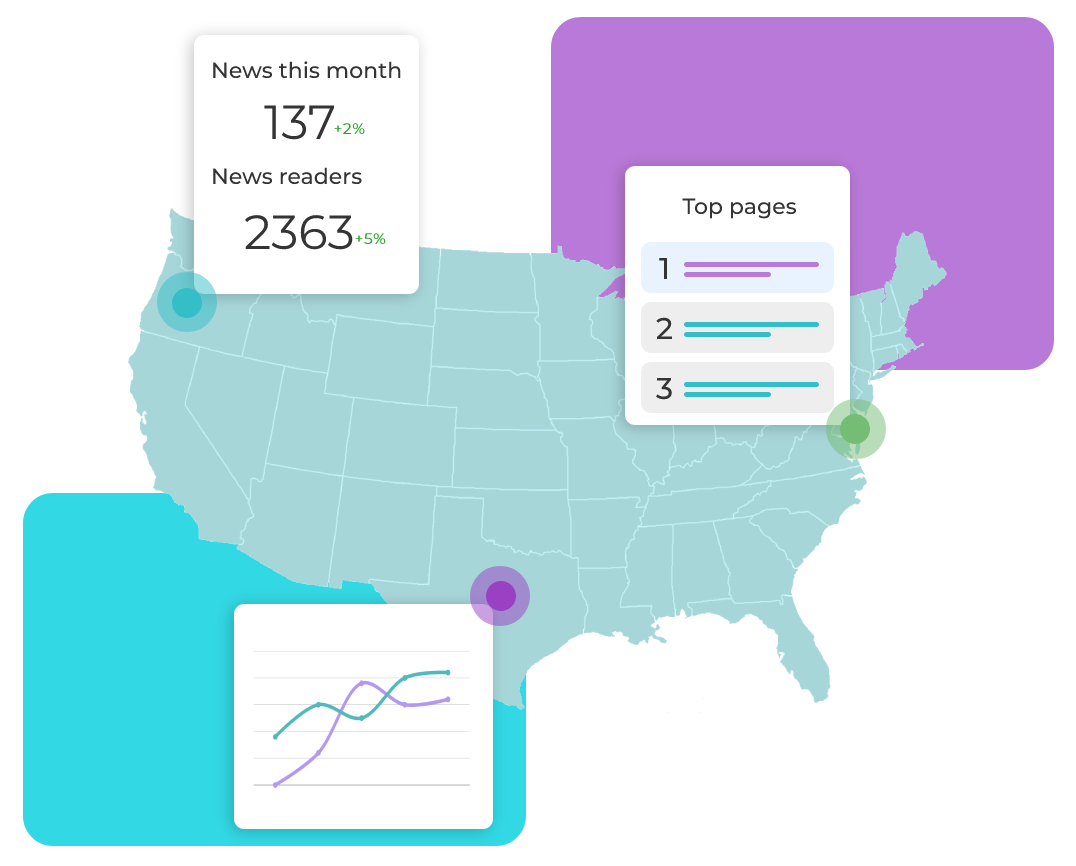
Which regions are the most engaged?
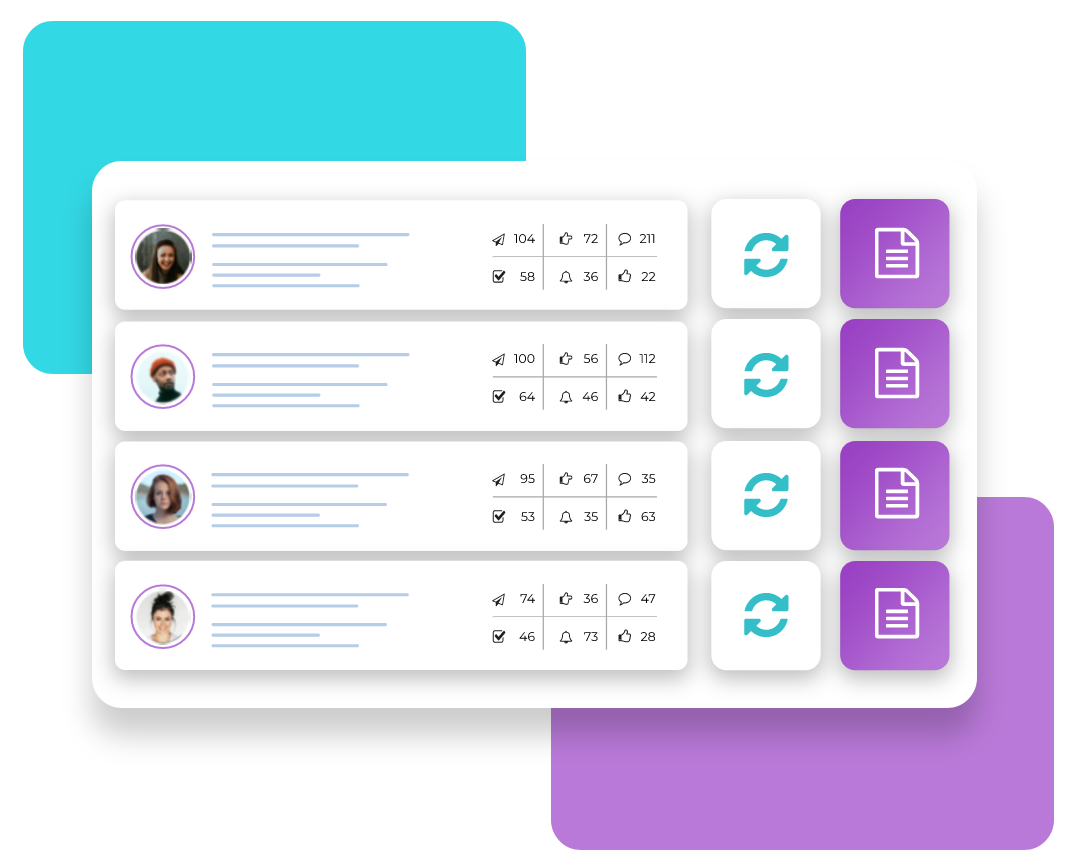
Which content resonates with your audience?
Guess no more and accurately analyze what’s working and what’s not
Identify your top news
on any time period
What are your top news this month? This quarter? Or this year?
Easily analyze your top performing content to identify what’s engaging your colleagues

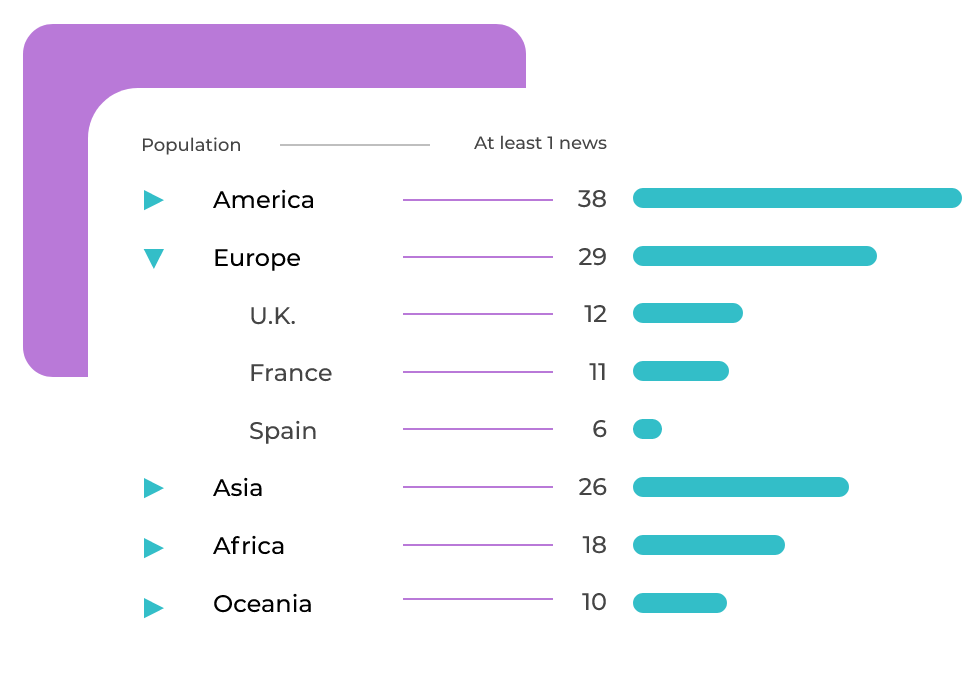
Analyze the audiences you reach
Set up your organization structure to analyze which types of user (country, department, business unit…) has seen any given communication.

Filter all your content by type
Compare similar content by filtering on their type (SharePoint metadata).
For example compare the performance of all your “corporate news” or “CEO message” this quarter
Tryane Analytics VS Google Analytics
Get 70% more data than with Google Analytics
Full data privacy and security compliance – SOC 2 certified
Full ownership of your data hosted in France
Customize with your Org Chart in just 1-click
Built for SharePoint, not for the web
Custom dashboard & automated reports
Do you want to know how analytics could help improve your impact? Contact us!